Questa è la quarta e ultima parte della serie Benchmarking Managed PostgreSQLCloud Solutions . Al momento della stesura di questo articolo, Microsoft Azure PostgreSQL era alla versione 10.7, più recente dei due contendenti:Amazon Aurora PostgreSQL alla versione 10.6 e Google Cloud SQL per PostgreSQL alla versione 9.6.
Microsoft ha deciso di eseguire Azure PostgreSQL su Windows:
postgres=> select version();
                        version
------------------------------------------------------------
PostgreSQL 10.7, compiled by Visual C++ build 1800, 64-bit
(1 row)
Per questo particolare test che non ha funzionato troppo bene, e azzarderò indovinare che Microsoft è ben consapevole delle limitazioni, motivo per cui sotto l'ombrello di PostgreSQL offrono anche una versione di anteprima della versione Citus Data di PostgreSQL. L'approccio è simile alle versioni AWS PostgreSQL, RDS e rispettivamente Aurora.
Come nota a margine, durante la configurazione del mio account Azure, sono rimasto sbalordito dalla mancanza dell'autenticazione 2FA/MFA (Two-Factor/Multi-Factor) che ho ritenuto concessa con AWS Virtual MFA di Amazon e la verifica in 2 passaggi di Google. Microsoft offre l'autenticazione a più fattori solo ai clienti aziendali abbonati ad Active Directory o Office 365. Poiché Citus Cloud applica l'autenticazione a due fattori per il database di produzione, forse Microsoft non è molto lontana dall'implementarla in Azure.
TL;DR
Non ci sono risultati per Azure. Sull'istanza del database a 8 core, identica nel numero di core a quelli utilizzati su AWS e G Cloud, i test non sono stati completati a causa di errori del database. In un'istanza a 16 core, pgbench è stato completato e sysbench è arrivato al punto di creare le prime 3 tabelle, a quel punto ho interrotto il processo. Sebbene fossi disposto a spendere una ragionevole quantità di impegno, tempo e denaro per eseguire i test e documentare gli errori e le loro cause, l'obiettivo di questo esercizio era eseguire il benchmark, quindi non ho mai considerato di perseguire una risoluzione dei problemi avanzata o di contattare Supporto di Azure, né ho completato il test sysbench sul database a 16 core.
Istanze cloud
Cliente
L'istanza client di Azure più vicina all'istanza AWS selezionata all'inizio di questa serie di blog era un'istanza E32s v3 con le seguenti specifiche:
- vCPU:32 (16 core x 2 thread/core)
- RAM:256 GiB
- Archiviazione:SSD Azure Premium
- Rete:rete accelerata fino a 30 Gbps
Ecco uno screenshot del portale con i dettagli dell'istanza:
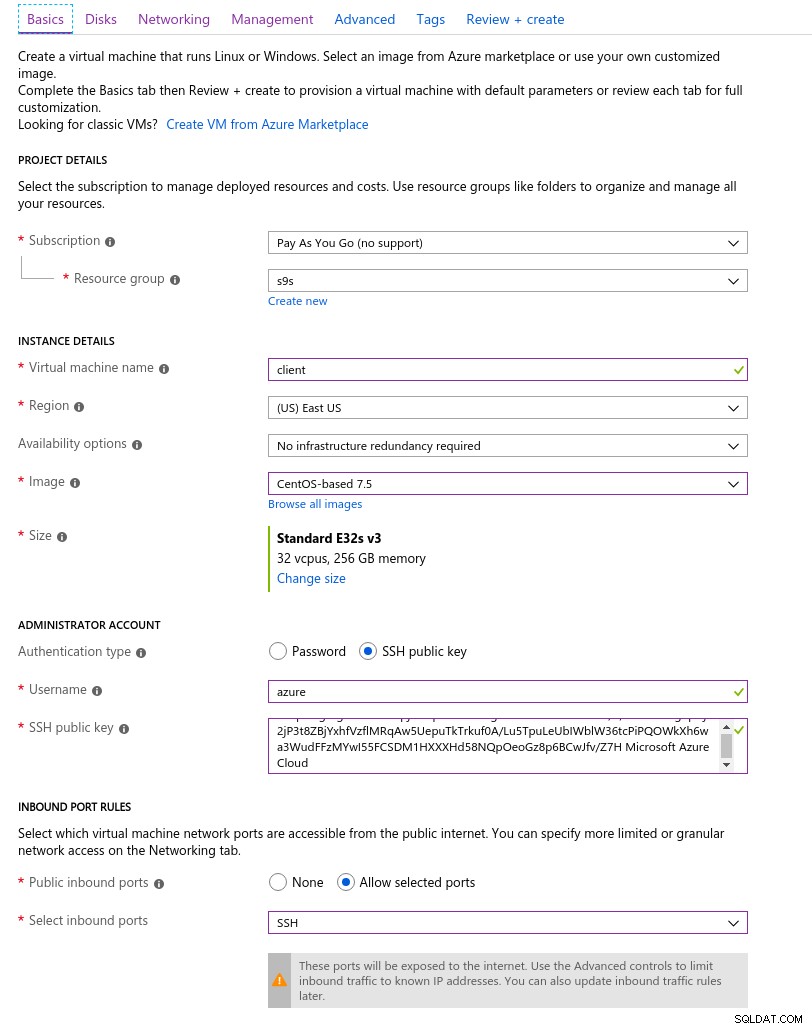 Dettagli dell'istanza del client
 La rete accelerata è abilitata per impostazione predefinita quando si sceglie una delle macchine virtuali supportate:
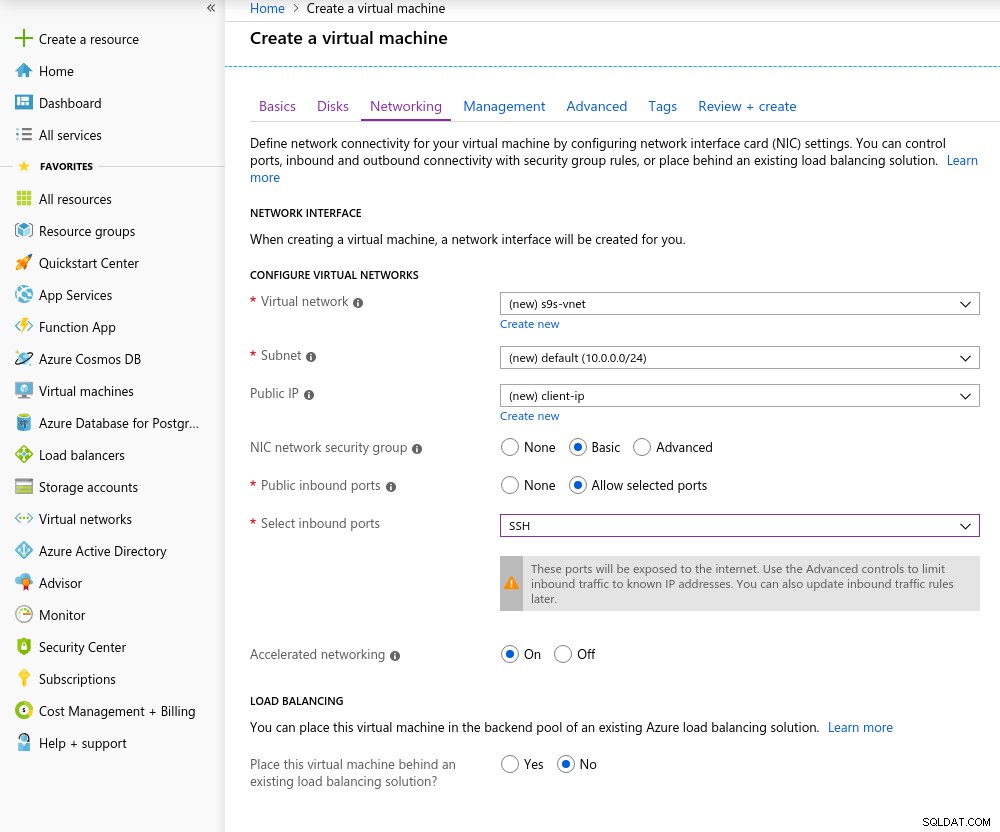 Rete accelerata attivata
 Dato che è la regola nel cloud, per ottenere le migliori prestazioni di rete, il client e il server devono trovarsi nella stessa zona di disponibilità, cosa che ho fatto impostando l'ambiente nella zona est degli Stati Uniti, AZ.
Analogamente a Google Cloud, è necessario richiedere un aumento della quota per le istanze con più di 10 core. Microsoft lo ha reso davvero facile. Una volta passato a un account a pagamento ho ricevuto la conferma di approvazione prima di poter completare la mia risposta nel ticket spiegando il motivo per cui sto richiedendo l'aumento.
Banca dati
Nella selezione della dimensione dell'istanza ho provato a far corrispondere le specifiche delle istanze utilizzate su AWS e Google Cloud:
- vCPU:8
- RAM:80 GiB (massimo)
- Archiviazione:6000 IOPS (dimensione 2TiB a 3 IOPS/GB)
- Rete:2.000 MB/s
Le dimensioni ridotte della memoria derivano dalla formula di memoria per vCore utilizzata per l'allocazione della memoria:
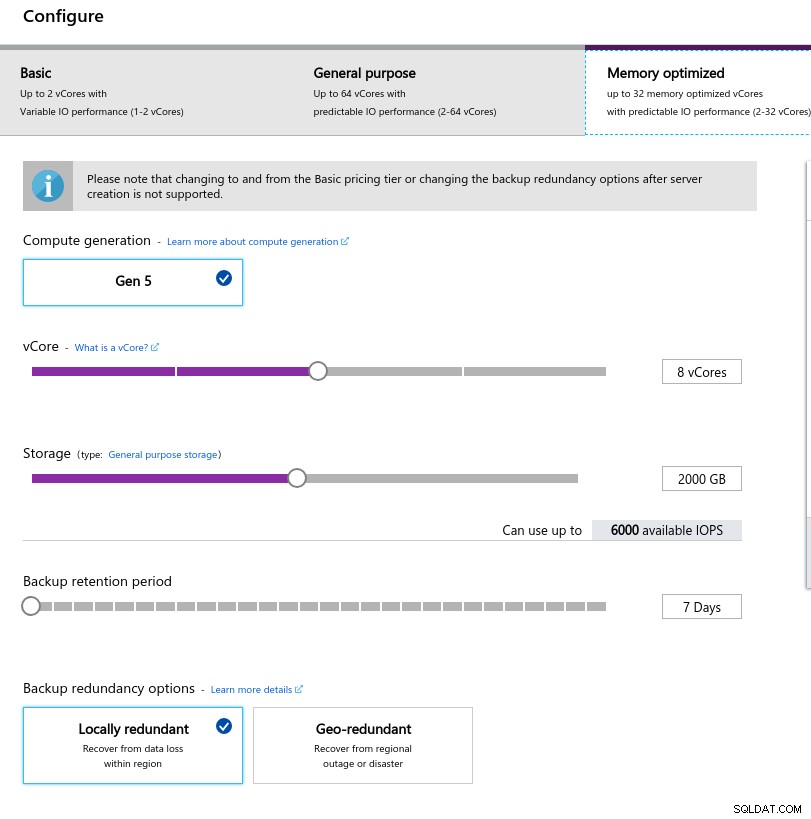 Configurazione dell'istanza del database
 Analogamente a Google Cloud, ea differenza di AWS, maggiore è lo storage, maggiore è l'IOPS, con un aumento del rapporto 3:1, tuttavia, una volta che la dimensione raggiunge 2TiB, l'IOPS è limitato a 6000 IOPS.
Esecuzione dei benchmark
Configurazione
L'installazione ha seguito il processo descritto nelle parti precedenti della serie di blog, con la patch di temporizzazione di AWS pgbench per 11.1 applicata in modo pulito ad Azure PostgreSQL versione 10.7. Le patch possono essere ottenute anche dai contributi di AWS Labs al repository Github di PostgreSQL.
Nel corso dell'esecuzione dei benchmark ho utilizzato il seguente script che segue solo la guida di Amazon e in questo caso è su misura per la versione PostgreSQL in Azure (10.7). La macchina client esegue CentOS 7.5:
#!/bin/bash

set -eE
trap "exit 1" ERR

yum -y install \
   wget ant git php gnuplot gcc make readline-devel zlib-devel \
   postgresql-jdbc bzr automake libtool patch libevent-devel \
   openssl-devel ncurses-devel

wget https://ftp.postgresql.org/pub/source/v10.7/postgresql-10.7.tar.gz
rm -rf postgresql-10.7
tar -xzf postgresql-10.7.tar.gz
cd postgresql-10.7
wget https://s3.amazonaws.com/aurora-pgbench-patches/pgbench-init-timing.patch
patch --verbose -p1 -b  < pgbench-init-timing.patch
./configure
make -j 4 all
make install
cd ..

rm -rf sysbench
git clone -b 0.5 https://github.com/akopytov/sysbench.git
cd sysbench
./autogen.sh
CFLAGS="-L/usr/local/pgsql/lib/ -I /usr/local/pgsql/include/" \
   | ./configure \
      --with-pgsql \
      --without-mysql \
      --with-pgsql-includes=/usr/local/pgsql/include/ \
      --with-pgsql-libs=/usr/local/pgsql/lib/
make
make install
cd sysbench/tests
make install

sed -i \
   '/^export PGHOST=/,/^export LD_LIBRARY_PATH.*pgsql/d' \
   ~/.bashrc
cat << "__eot__" >> ~/.bashrc
export PGHOST=CHANGEME
export PGUSER=postgres
export PGPASSWORD=postgres
export PGDATABASE=postgres
export PGPORT=5432
export PATH=/usr/local/pgsql/bin:/usr/local/bin:$PATH
export LD_LIBRARY_PATH=$LD_LIBRARY_PATH:/usr/local/pgsql/lib
__eot__

echo "All done."
Una volta completato lo script, modifica .bashrc per impostare le variabili di ambiente PostgreSQL. Azure è peculiare del formato del nome utente PostgreSQL poiché si aspetta un formato {nomeutente}@{host} anziché l'onnipresente {nomeutente}:
[example@sqldat.com scripts]# psql
psql: FATAL:  Invalid Username specified. Please check the Username and retry connection. The Username should be in <example@sqldat.com> format.
Prima di iniziare i test, verifica che stiamo utilizzando la versione corretta degli strumenti client:
[example@sqldat.com scripts]# psql --version
psql (PostgreSQL) 10.7
[example@sqldat.com scripts]# pgbench --version
pgbench (PostgreSQL) 10.7[example@sqldat.com scripts]# sysbench --version
sysbench 0.5pgench
Inizializza il database di pgbench.
[example@sqldat.com ~]# pgbench -i --fillfactor=90 --scale=10000…e qualche minuto dopo:
[example@sqldat.com scripts]# pgbench -i --fillfactor=90 --scale=10000
NOTICE:  table "pgbench_history" does not exist, skipping
NOTICE:  table "pgbench_tellers" does not exist, skipping
NOTICE:  table "pgbench_accounts" does not exist, skipping
NOTICE:  table "pgbench_branches" does not exist, skipping
creating tables...
100000 of 1000000000 tuples (0%) done (elapsed 0.04 s, remaining 426.44 s)
200000 of 1000000000 tuples (0%) done (elapsed 0.09 s, remaining 427.22 s)
300000 of 1000000000 tuples (0%) done (elapsed 0.18 s, remaining 600.63 s)
400000 of 1000000000 tuples (0%) done (elapsed 0.21 s, remaining 530.99 s)
500000 of 1000000000 tuples (0%) done (elapsed 0.30 s, remaining 595.12 s)

...

584300000 of 1000000000 tuples (58%) done (elapsed 2421.82 s, remaining 1723.01 s)
584400000 of 1000000000 tuples (58%) done (elapsed 2421.86 s, remaining 1722.32 s)
584500000 of 1000000000 tuples (58%) done (elapsed 2422.81 s, remaining 1722.29 s)
584600000 of 1000000000 tuples (58%) done (elapsed 2422.84 s, remaining 1721.60 s)
584700000 of 1000000000 tuples (58%) done (elapsed 2422.88 s, remaining 1720.92 s)
584800000 of 1000000000 tuples (58%) done (elapsed 2425.06 s, remaining 1721.76 s)
584900000 of 1000000000 tuples (58%) done (elapsed 2425.09 s, remaining 1721.07 s)
585000000 of 1000000000 tuples (58%) done (elapsed 2425.28 s, remaining 1720.50 s)
...

999700000 of 1000000000 tuples (99%) done (elapsed 4142.69 s, remaining 1.24 s)
999800000 of 1000000000 tuples (99%) done (elapsed 4142.95 s, remaining 0.83 s)
999900000 of 1000000000 tuples (99%) done (elapsed 4142.98 s, remaining 0.41 s)
1000000000 of 1000000000 tuples (100%) done (elapsed 4143.92 s, remaining 0.00 s)
vacuum...
set primary keys...
total time: 14805.73 s (insert 4146.94 s, commit 0.02 s, vacuum 6581.15 s, index 4077.61 s)
done.
Fin qui tutto bene.
Una rapida occhiata al database per confermare che è pronto per l'uso:
example@sqldat.com:5432 postgres> \l+
                                                                                                List of databases
      Name        |      Owner      | Encoding |          Collate           |           Ctype            |          Access privileges          |   Size    | Table space |                Description
-------------------+-----------------+----------+----------------------------+----------------------------+-------------------------------------+-----------+------------+--------------------------------------------
azure_maintenance | azure_superuser | UTF8     | English_United States.1252 | English_United States.1252 | azure_superuser=CTc/azure_superuser | No Access | pg_default  |
azure_sys         | azure_superuser | UTF8     | English_United States.1252 | English_United States.1252 |                                     | 12 MB     | pg_default  |
postgres          | azure_superuser | UTF8     | English_United States.1252 | English_United States.1252 |                                     | 160 GB    | pg_default  | default administrative connection database
template0         | azure_superuser | UTF8     | English_United States.1252 | English_United States.1252 | =c/azure_superuser                 +| 7865 kB   | pg_default  | unmodifiable empty database
                  |                 |          |                            |                            | azure_superuser=CTc/azure_superuser |           |             |
template1         | azure_superuser | UTF8     | English_United States.1252 | English_United States.1252 | =c/azure_superuser                 +| 7865 kB   | pg_default  | default template for new databases
                  |                 |          |                            |                            | azure_superuser=CTc/azure_superuser |           |             |
(5 rows)
Poiché Azure non consente di modificare max_connections e dato che per l'istanza selezionata il limite è limitato a 960, dovremo regolare di conseguenza il numero di client pgbench:
[example@sqldat.com scripts]# pgbench --protocol=prepared -P 60 --time=600 --client=950 --jobs=2048
starting vacuum...end.
connection to database "postgres" failed:
could not translate host name "postgresql-10-7.postgres.database.azure.com" to address: Name or service not known
connection to database "postgres" failed:
could not translate host name "postgresql-10-7.postgres.database.azure.com" to address: Name or service not known
Ed eccolo, il primo singhiozzo.
Un rapido controllo della risoluzione del DNS dell'host non mostra alcun problema:
[example@sqldat.com scripts]# dig +short $PGHOST
cr1.eastus1-a.control.database.windows.net.
191.238.6.43
[example@sqldat.com scripts]# cat /etc/resolv.conf
; generated by /usr/sbin/dhclient-script
search 11jv1qvdjs5utlhtlyb5vdyeth.bx.internal.cloudapp.net
nameserver 168.63.129.16Una revisione del mio screenlog mostra che quasi la metà delle connessioni è stata interrotta:
~$ cat screenlog.1 | nl | grep 'could not translate host name "postgresql-10-7.*Name or service not known' | wc -l
469
pg_stat_activity racconta una storia più dettagliata:raggiungiamo 950 connessioni:
example@sqldat.com:5432 postgres> select now(), count(*) from pg_stat_activity where usename = 'postgres' and application_name = 'pgbench';                                now              | count
-------------------------------+-------
2019-05-03 23:39:18.200291+00 |   950
(1 row)
…tuttavia, il monitoraggio della query di cui sopra mostra un improvviso calo del numero di connessioni da 950 a 628, in soli 10 secondi:
example@sqldat.com:5432 postgres> \watch 10
Fri 03 May 2019 11:41:05 PM UTC (every 10s)

            now              | count
-------------------------------+-------
2019-05-03 23:41:05.044025+00 |   950
(1 row)

...

Fri 03 May 2019 11:43:10 PM UTC (every 10s)

            now              | count
-------------------------------+-------
2019-05-03 23:43:10.512766+00 |   950
(1 row)

Fri 03 May 2019 11:43:20 PM UTC (every 10s)

            now              | count
-------------------------------+-------
2019-05-03 23:43:17.419011+00 |   628
(1 row)

Fri 03 May 2019 11:43:30 PM UTC (every 10s)

            now              | count
-------------------------------+-------
2019-05-03 23:43:31.434638+00 |   613
(1 row)
Per aggirare il problema del DNS, ho assegnato a PGHOST l'indirizzo IP dell'host:
[example@sqldat.com scripts]# set | grep PG
PGDATABASE=postgres
PGHOST=191.238.6.43
example@sqldat.com
PGPORT=5432
example@sqldat.com
Con quella soluzione alternativa ho riavviato il test:
[example@sqldat.com scripts]# pgbench --protocol=prepared -P 60 --time=600 --client=950 --jobs=2048
starting vacuum...end.
progress: 61.1 s, 457.7 tps, lat 559.138 ms stddev 1755.888
progress: 120.1 s, 78.8 tps, lat 3883.772 ms stddev 10551.545
progress: 180.1 s, 17.6 tps, lat 50831.708 ms stddev 31214.512
progress: 240.1 s, 15.2 tps, lat 42474.763 ms stddev 32702.050
progress: 300.1 s, 16.1 tps, lat 43584.559 ms stddev 29818.142
progress: 360.1 s, 26.5 tps, lat 36914.096 ms stddev 37152.588
progress: 420.0 s, 33.4 tps, lat 27542.926 ms stddev 37075.457
progress: 480.0 s, 20.2 tps, lat 47149.060 ms stddev 47087.474
progress: 540.0 s, 13.5 tps, lat 55609.260 ms stddev 60394.287
progress: 600.0 s, 36.5 tps, lat 49566.853 ms stddev 99155.598

transaction type: <builtin: TPC-B (sort of)>
scaling factor: 10000
query mode: prepared
number of clients: 950
number of threads: 950
duration: 600 s
number of transactions actually processed: 44293
latency average = 12493.888 ms
latency stddev = 40490.231 ms
tps = 60.907130 (including connections establishing)
tps = 64.213520 (excluding connections establishing)
A prima vista, le cose sembravano aver funzionato bene, tuttavia, i valori di latenza estremamente elevati, insieme ai precedenti problemi DNS e al client abilitato "rete accelerata", suggeriscono che qualcosa non va a livello di rete, e questo è il probabile causa di risultati con tps bassi. Ma il peggio deve ancora venire.
Scarica il whitepaper oggi Gestione e automazione di PostgreSQL con ClusterControlScopri cosa devi sapere per distribuire, monitorare, gestire e ridimensionare PostgreSQLScarica il whitepapersistema di analisi
Per prima cosa, crea le tabelle:
sysbench --test=/usr/local/share/sysbench/oltp.lua \
--pgsql-host=${PGHOST} \
--pgsql-db=${PGDATABASE} \
--pgsql-user=${PGUSER} \
--pgsql-password=${PGPASSWORD} \
--pgsql-port=${PGPORT} \
--oltp-tables-count=250\
--oltp-table-size=450000 \
prepare
After a little while:
sysbench 0.5:  multi-threaded system evaluation benchmark

Creating table 'sbtest1'...
FATAL: PQexec() failed: 7 server closed the connection unexpectedly
        This probably means the server terminated abnormally
        before or while processing the request.

FATAL: failed query: CREATE TABLE sbtest1 (
id SERIAL NOT NULL,
k INTEGER DEFAULT '0' NOT NULL,
c CHAR(120) DEFAULT '' NOT NULL,
pad CHAR(60) DEFAULT '' NOT NULL,
PRIMARY KEY (id)
)
FATAL: failed to execute function `prepare': 3
Non sembrava affatto buono, quindi ho controllato i log di PostgreSQL:
2019-05-03 23:51:12 UTC-5ccbbe4f.88-WARNING:  worker took too long to start; canceled
2019-05-03 23:51:14 UTC-5ccbbe4f.84-PANIC:  could not write to log file 000000010000001F000000CD at offset 13664256, length 8192: Invalid argument
+++ NT HARD ERROR (0xd0000144) +++
    Parameter 0: 0xffffffffc0000005
    Parameter 1: 0x1b80f0f73b
    Parameter 2: 0x1
    Parameter 3: 0x0
Sebbene il servizio dovrebbe ripristinarsi da solo, ho deciso di riavviare l'istanza per accelerare il processo.
2019-05-04 00:43:23 UTC-5ccce02a.2c-HINT:  Is another postmaster already running on port 20108? If not, wait a few seconds and retry.
2019-05-04 00:43:23 UTC-5ccce02a.2c-LOG:  could not bind IPv6 address "::": A socket operation was attempted to an unreachable host.
2019-05-04 00:43:23 UTC-5ccce02a.2c-LOG:  listening on IPv4 address "0.0.0.0", port 20108
2019-05-04 00:43:24 UTC-5ccce02a.2c-LOG:  database system is ready to accept connections
...
2019-05-05 00:03:35 UTC-5cce2856.2c-HINT:  Is another postmaster already running on port 20326? If not, wait a few seconds and retry.
2019-05-05 00:03:35 UTC-5cce2856.2c-LOG:  could not bind IPv6 address "::": A socket operation was attempted to an unreachable host.
2019-05-05 00:03:35 UTC-5cce2856.2c-LOG:  listening on IPv4 address "0.0.0.0", port 20326
2019-05-05 00:03:38 UTC-5cce285a.3c-FATAL:  the database system is starting up
2019-05-05 00:03:38 UTC-5cce285a.3c-LOG:  connection received: host=127.0.0.1 port=47247 pid=60
2019-05-05 00:03:49 UTC-5cce2865.40-FATAL:  the database system is starting up
2019-05-05 00:03:49 UTC-5cce2865.40-LOG:  connection received: host=127.0.0.1 port=47284 pid=64
2019-05-05 00:03:59 UTC-5cce286f.44-FATAL:  the database system is starting up
2019-05-05 00:03:59 UTC-5cce286f.44-LOG:  connection received: host=127.0.0.1 port=47312 pid=68
2019-05-05 00:04:00 UTC-5cce2856.2c-LOG:  database system is ready to accept connections
2019-05-05 00:04:00 UTC-5cce2870.38-LOG:  database system was shut down at 2019-05-05 00:03:34 UTC
A questo punto ho anche abilitato le informazioni sulle prestazioni delle query:
2019-05-05 00:04:13 UTC-5cce2856.2c-LOG:  parameter "pgms_wait_sampling.query_capture_mode" changed to "ALL"
2019-05-05 00:04:13 UTC-5cce2856.2c-LOG:  parameter "pg_qs.query_capture_mode" changed to "TOP"
2019-05-05 00:04:13 UTC-5cce2856.2c-LOG:  received SIGHUP, reloading configuration files
2019-05-05 00:04:13 UTC-5cce2856.2c-LOG:  received SIGHUP, reloading configuration files
2019-05-05 00:04:13 UTC-5cce287a.6c-ERROR:  database "azure_sys" already exists
2019-05-05 00:04:13 UTC-5cce287a.6c-STATEMENT:  CREATE DATABASE azure_sys TEMPLATE template0
Prima di riavviare l'attività sysbench, volevo assicurarmi che il database fosse integro e quindi ho avviato un secondo test di pgbench:
[example@sqldat.com scripts]# pgbench --protocol=prepared -P 60 --time=600 --client=950 --jobs=2048
starting vacuum...end.
connection to database "postgres" failed:
server closed the connection unexpectedly
        This probably means the server terminated abnormally
        before or while processing the request.
connection to database "postgres" failed:
server closed the connection unexpectedly
        This probably means the server terminated abnormally
        before or while processing the request.
connection to database "postgres" failed:
server closed the connection unexpectedly
        This probably means the server terminated abnormally
        before or while processing the request.
connection to database "postgres" failed:
server closed the connection unexpectedly
        This probably means the server terminated abnormally
        before or while processing the request.
Secondo il monitor della query pg_stat_activity, il server è morto quando il numero di connessioni ha raggiunto 710:
example@sqldat.com:5432 postgres> \watch 1
Sun 05 May 2019 12:44:11 AM UTC (every 1s)

            now              | count
-------------------------------+-------
2019-05-05 00:44:11.010413+00 |   220
(1 row)

Sun 05 May 2019 12:44:12 AM UTC (every 1s)

            now              | count
-------------------------------+-------
2019-05-05 00:44:12.041667+00 |   231
(1 row)

...

            now              | count
------------------------------+-------
2019-05-05 00:47:33.16533+00 |   710
(1 row)

Sun 05 May 2019 12:47:40 AM UTC (every 1s)

            now              | count
-------------------------------+-------
2019-05-05 00:47:40.524662+00 |   710
(1 row)
E dai log di PostgreSQL apprendiamo che è successo qualcosa lungo il tubo di connessione:
2019-05-05 00:44:11 UTC-5cce31da.c60-LOG:  connection received: host=40.114.85.62 port=50925 pid=3168
2019-05-05 00:44:11 UTC-5cce31db.c58-LOG:  connection received: host=40.114.85.62 port=55256 pid=3160
2019-05-05 00:44:11 UTC-5cce31db.c5c-LOG:  connection received: host=40.114.85.62 port=34526 pid=3164
2019-05-05 00:44:11 UTC-5cce31db.c64-LOG:  connection received: host=40.114.85.62 port=1178 pid=3172
...
2019-05-05 00:47:32 UTC-5cce329a.146c-LOG:  connection received: host=40.114.85.62 port=41769 pid=5228
2019-05-05 00:47:33 UTC-5cce3287.1404-LOG:  connection authorized: user=postgresdatabase=postgres SSL enabled (protocol=TLSv1.1, cipher=ECDHE-RSA-AES256-SHA, compression=off)
2019-05-05 00:47:33 UTC-5cce3288.1428-LOG:  connection authorized: user=postgresdatabase=postgres SSL enabled (protocol=TLSv1.1, cipher=ECDHE-RSA-AES256-SHA, compression=off)
2019-05-05 00:47:33 UTC-5cce3289.1434-LOG:  connection authorized: user=postgresdatabase=postgres SSL enabled (protocol=TLSv1.1, cipher=ECDHE-RSA-AES256-SHA, compression=off)
2019-05-05 00:47:33 UTC-5cce3291.1448-LOG:  connection authorized: user=postgresdatabase=postgres SSL enabled (protocol=TLSv1.1, cipher=ECDHE-RSA-AES256-SHA, compression=off)
2019-05-05 00:47:33 UTC-5cce32a3.1484-LOG:  connection received: host=40.114.85.62 port=50296 pid=5252
2019-05-05 00:47:33 UTC-5cce32a5.1488-LOG:  connection received: host=40.114.85.62 port=28304 pid=5256
2019-05-05 00:47:39 UTC-5cce31d2.a24-LOG:  could not send data to client: An existing connection was forcibly closed by the remote host.
2019-05-05 00:47:39 UTC-5cce31d5.ae8-LOG:  could not receive data from client: An existing connection was forcibly closed by the remote host.
2019-05-05 00:47:39 UTC-5cce31e3.ee4-LOG:  could not send data to client: An existing connection was forcibly closed by the remote host.
2019-05-05 00:47:39 UTC-5cce31e9.1054-LOG:  could not receive data from client: An existing connection was forcibly closed by the remote host.
2019-05-05 00:47:39 UTC-5cce3291.1444-LOG:  could not receive data from client: An existing connection was forcibly closed by the remote host.
2019-05-05 00:47:40 UTC-5cce31cd.8ec-LOG:  could not send data to client: An existing connection was forcibly closed by the remote host.
Di fronte alla limitazione di max_connections e ai problemi riscontrati durante i test di pgbench e sysbench, ho iniziato a incuriosirmi se un database a 16 core avrebbe mostrato lo stesso comportamento.
Istanza database a 16 core
In un'istanza di database a 16 core il limite max_connections è sufficientemente grande per ospitare 1000 client:
example@sqldat.com:5432 postgres> show max_connections ;
 max_connections
-----------------
 1900
(1 row)
Ciò mi ha permesso di eseguire gli stessi comandi di benchmark che usavo sui precedenti provider di servizi cloud.
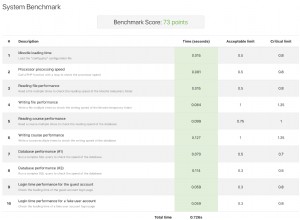
Il benchmark è stato completato con successo e i risultati sono riportati di seguito:
pannello di gioco
- Inizializzazione:
[example@sqldat.com scripts]# pgbench -i --fillfactor=90 --scale=10000 NOTICE: table "pgbench_history" does not exist, skipping NOTICE: table "pgbench_tellers" does not exist, skipping NOTICE: table "pgbench_accounts" does not exist, skipping NOTICE: table "pgbench_branches" does not exist, skipping creating tables... 100000 of 1000000000 tuples (0%) done (elapsed 0.08 s, remaining 807.39 s) 200000 of 1000000000 tuples (0%) done (elapsed 0.13 s, remaining 628.37 s) 300000 of 1000000000 tuples (0%) done (elapsed 0.16 s, remaining 527.89 s) ... 600100000 of 1000000000 tuples (60%) done (elapsed 2499.90 s, remaining 1665.90 s) 600200000 of 1000000000 tuples (60%) done (elapsed 2500.07 s, remaining 1665.33 s) ... 999900000 of 1000000000 tuples (99%) done (elapsed 4170.91 s, remaining 0.42 s) 1000000000 of 1000000000 tuples (100%) done (elapsed 4171.29 s, remaining 0.00 s) vacuum... set primary keys... total time: 13701.50 s (insert 4173.33 s, commit 0.05 s, vacuum 7098.74 s, index 2429.39 s) done. - Esegui:
[example@sqldat.com scripts]# pgbench --protocol=prepared -P 60 --time=600 --client=1000 --jobs=2048
starting vacuum...end.
progress: 81.4 s, 5639.1 tps, lat 80.094 ms stddev 73.213
progress: 120.0 s, 4091.0 tps, lat 224.161 ms stddev 608.523
progress: 180.0 s, 6932.1 tps, lat 145.143 ms stddev 228.925
progress: 240.0 s, 7287.9 tps, lat 136.521 ms stddev 156.643
progress: 300.0 s, 7567.8 tps, lat 132.722 ms stddev 158.754
progress: 360.0 s, 8077.9 tps, lat 123.801 ms stddev 139.033
progress: 420.0 s, 6076.9 tps, lat 163.886 ms stddev 201.121
progress: 480.0 s, 5376.2 tps, lat 186.678 ms stddev 191.270
progress: 540.0 s, 4864.0 tps, lat 205.696 ms stddev 164.261
progress: 600.0 s, 3759.3 tps, lat 266.073 ms stddev 542.717
transaction type: <builtin: TPC-B (sort of)>
scaling factor: 10000
query mode: prepared
number of clients: 1000
number of threads: 1000
duration: 600 s
number of transactions actually processed: 3614386
latency average = 152.935 ms
latency stddev = 248.593 ms
tps = 6002.082008 (including connections establishing)
tps = 6513.306467 (excluding connections establishing)
È andato abbastanza bene, tuttavia, non esiste un modo valido per confrontare questi risultati con quelli di AWS e G Cloud, poiché non stiamo testando su una piattaforma simile. Ma questo è abbastanza buono per portarci al punto successivo.
sistema di analisi
Poiché i test di pgbench sono stati completati con successo, ho deciso di sfruttare appieno il credito di $ 200 di Azure e di confermare che sysbench va oltre l'esecuzione precedente sull'istanza a 8 core:
sysbench \
   --test=/usr/local/share/sysbench/oltp.lua \
   --pgsql-host=191.238.6.43 \
   --pgsql-db=postgres \
   example@sqldat.com \
   example@sqldat.com \
   --pgsql-port=5432 \
   --oltp-tables-count=250 \
   --oltp-table-size=450000 prepare

sysbench 0.5:  multi-threaded system evaluation benchmark

Creating table 'sbtest1'...
Inserting 450000 records into 'sbtest1'
Creating secondary indexes on 'sbtest1'...
Creating table 'sbtest2'...
Inserting 450000 records into 'sbtest2'
Creating secondary indexes on 'sbtest2'...
Creating table 'sbtest3'...
Inserting 450000 records into 'sbtest3'
Creating secondary indexes on 'sbtest3'...
Creating table 'sbtest4'...
Sembrava funzionare bene e, poiché mi stavo avvicinando al mio budget, ho deciso di interrompere l'attività.
Iperscala (Citus)
Sebbene non sia pronta per la produzione, questa opzione meritava di essere esaminata, in quanto fornisce funzionalità avanzate non disponibili in AWS e G Cloud.
Come risultato dell'acquisizione di Citus Data, Microsoft offre una versione di anteprima del loro prodotto di punta PostgreSQL, sotto il nome di Hyperscale (Citus).
La procedura guidata del portale rende la configurazione di un ambiente altrimenti complicato, un gioco da ragazzi:
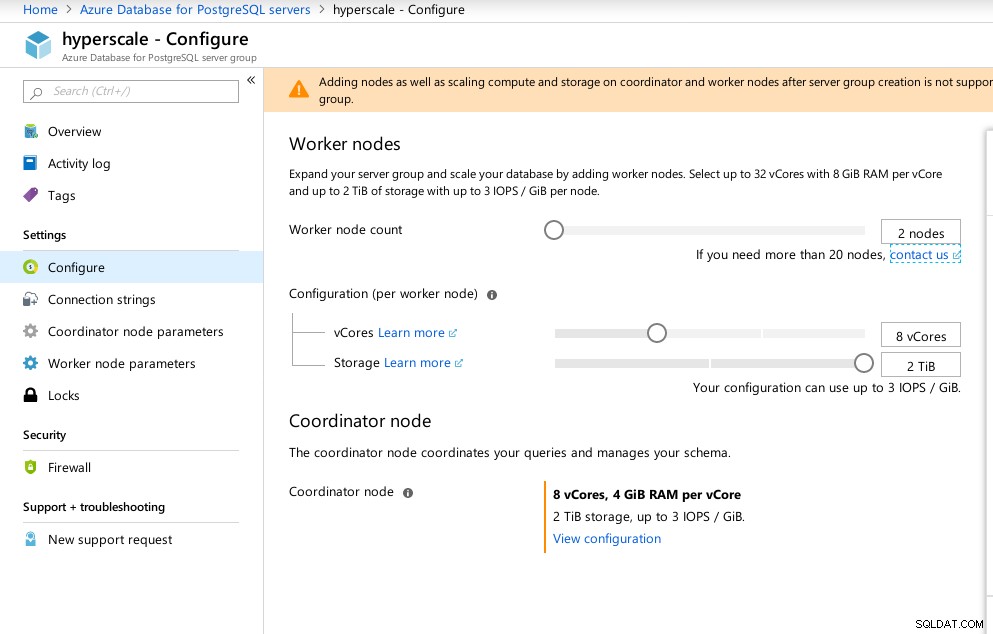 Configurazione Azure Hyperscale (Citus)
 Ho notato che, a differenza di Azure PostgreSQL che funziona su Windows, Hyperscale funziona su Linux:
example@sqldat.com:5432 citus> select version();
                                                    version
----------------------------------------------------------------------------------------------------------------
 PostgreSQL 11.2 on x86_64-pc-linux-gnu, compiled by gcc (Ubuntu 5.4.0-6ubuntu1~16.04.5) 5.4.0 20160609, 64-bit
(1 row)
Sfortunatamente, mentre Hyperscale prometteva un viaggio entusiasmante, in questo momento non potevo andare avanti con l'esecuzione dei test poiché max_connections è attualmente limitato a 300, senza opzioni di regolazione, sebbene l'abilità sia documentata per Citus PosgreSQL nativo:
example@sqldat.com:5432 citus> show max_connections ;
max_connections
-----------------
300
(1 row)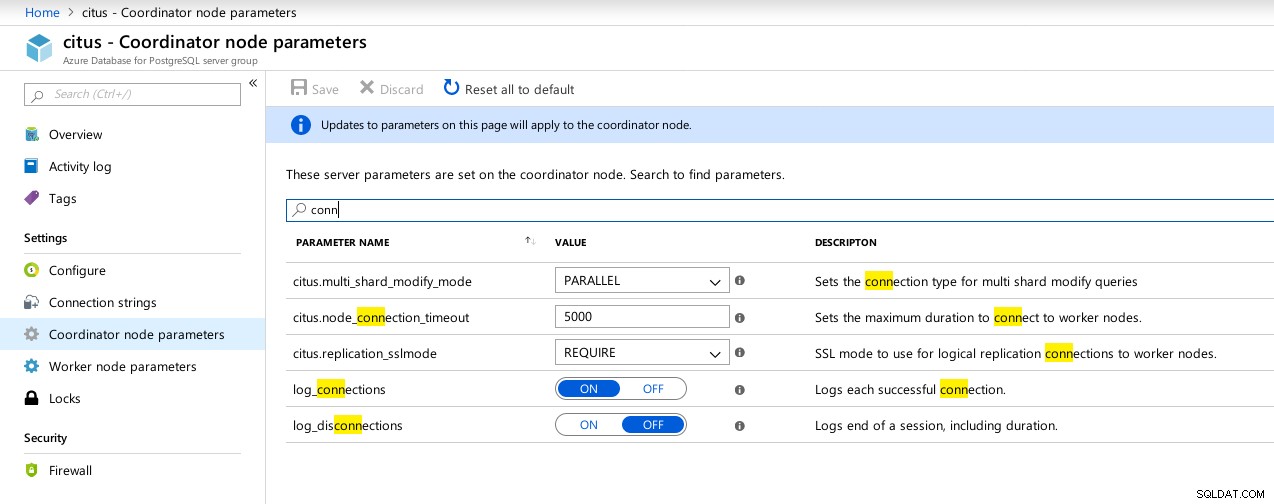 Hyperscale (Citus) Connessioni del coordinatore parametri disponibili
 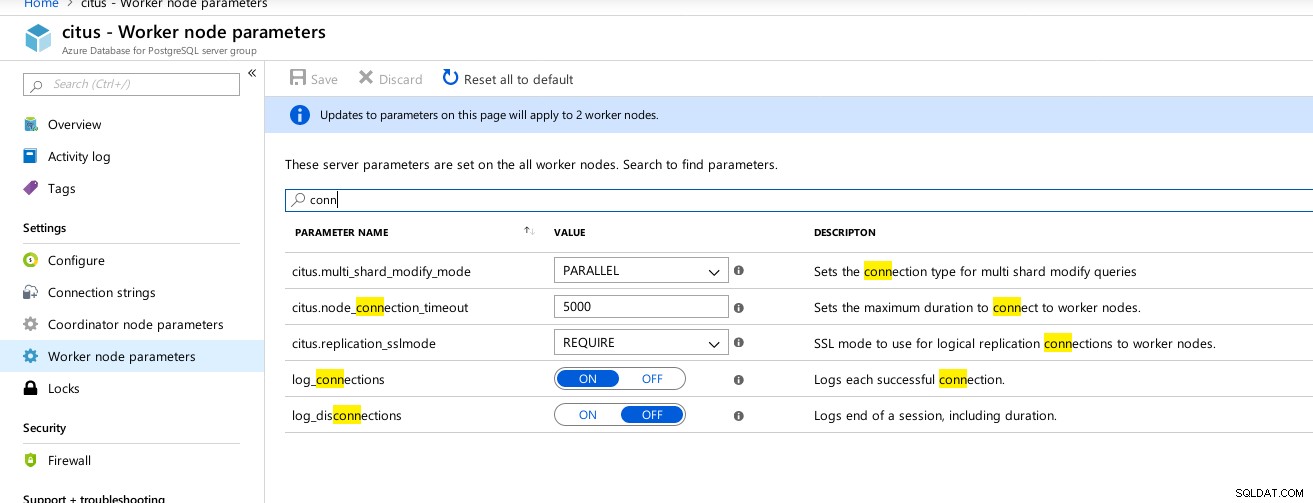 Hyperscale (Citus) Workers:max_connections non disponibile
 Metriche benchmark
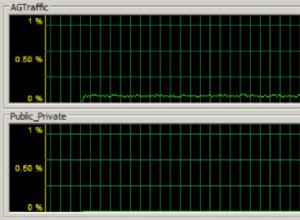
Alcuni parametri indicativi delle prestazioni e del comportamento di client e server:
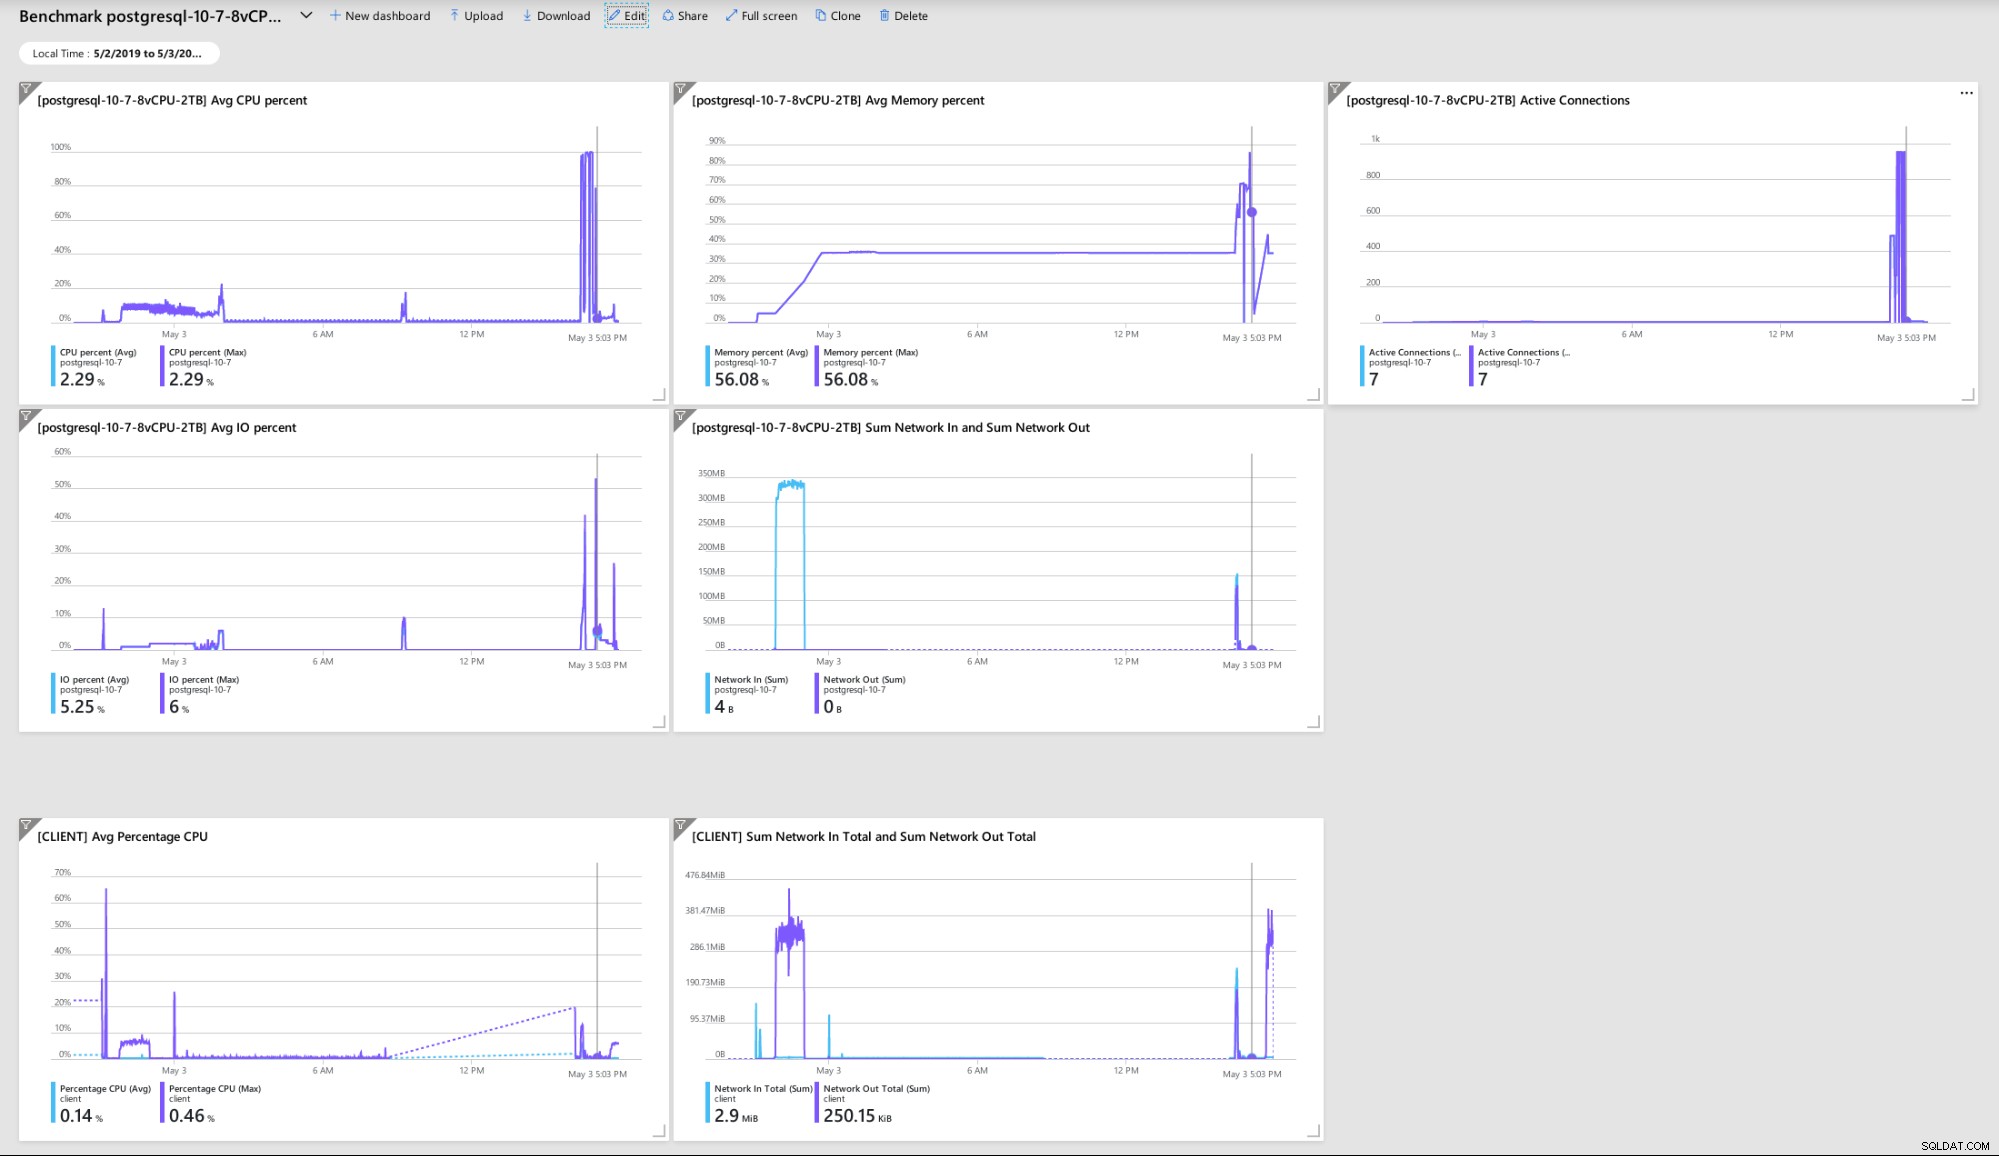 Dashboard del portale di Azure - Metriche per client e server
 Metriche PostgreSQL raccolte utilizzando Query Performance Insight:
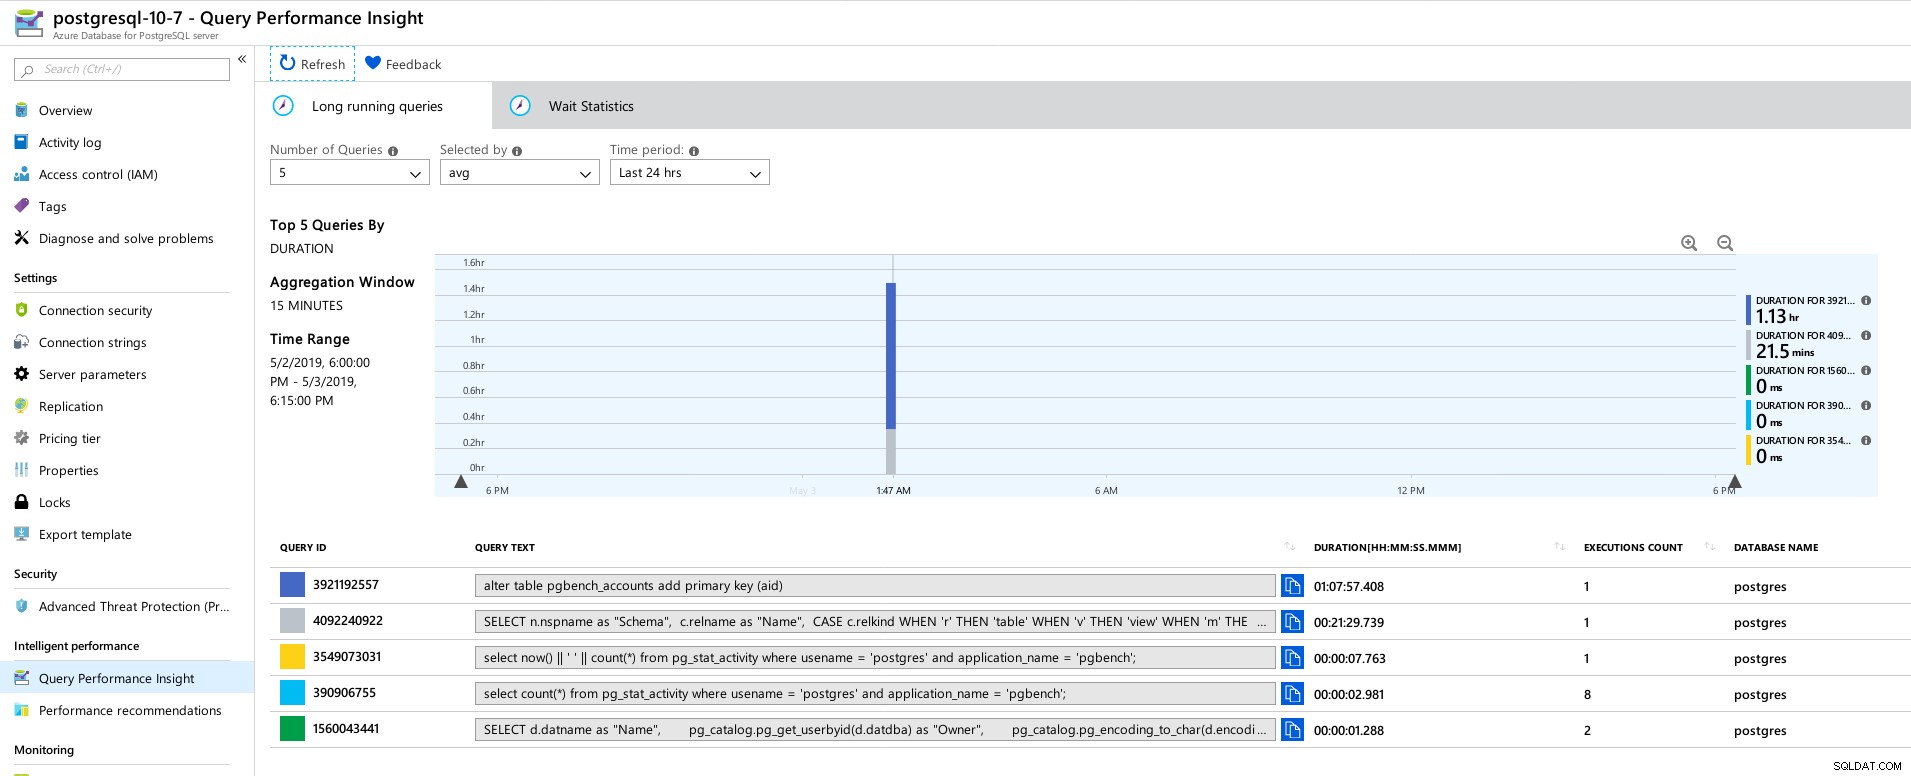 Azure PostgreSQL - Informazioni dettagliate sulle prestazioni delle query:le prime 5 query
 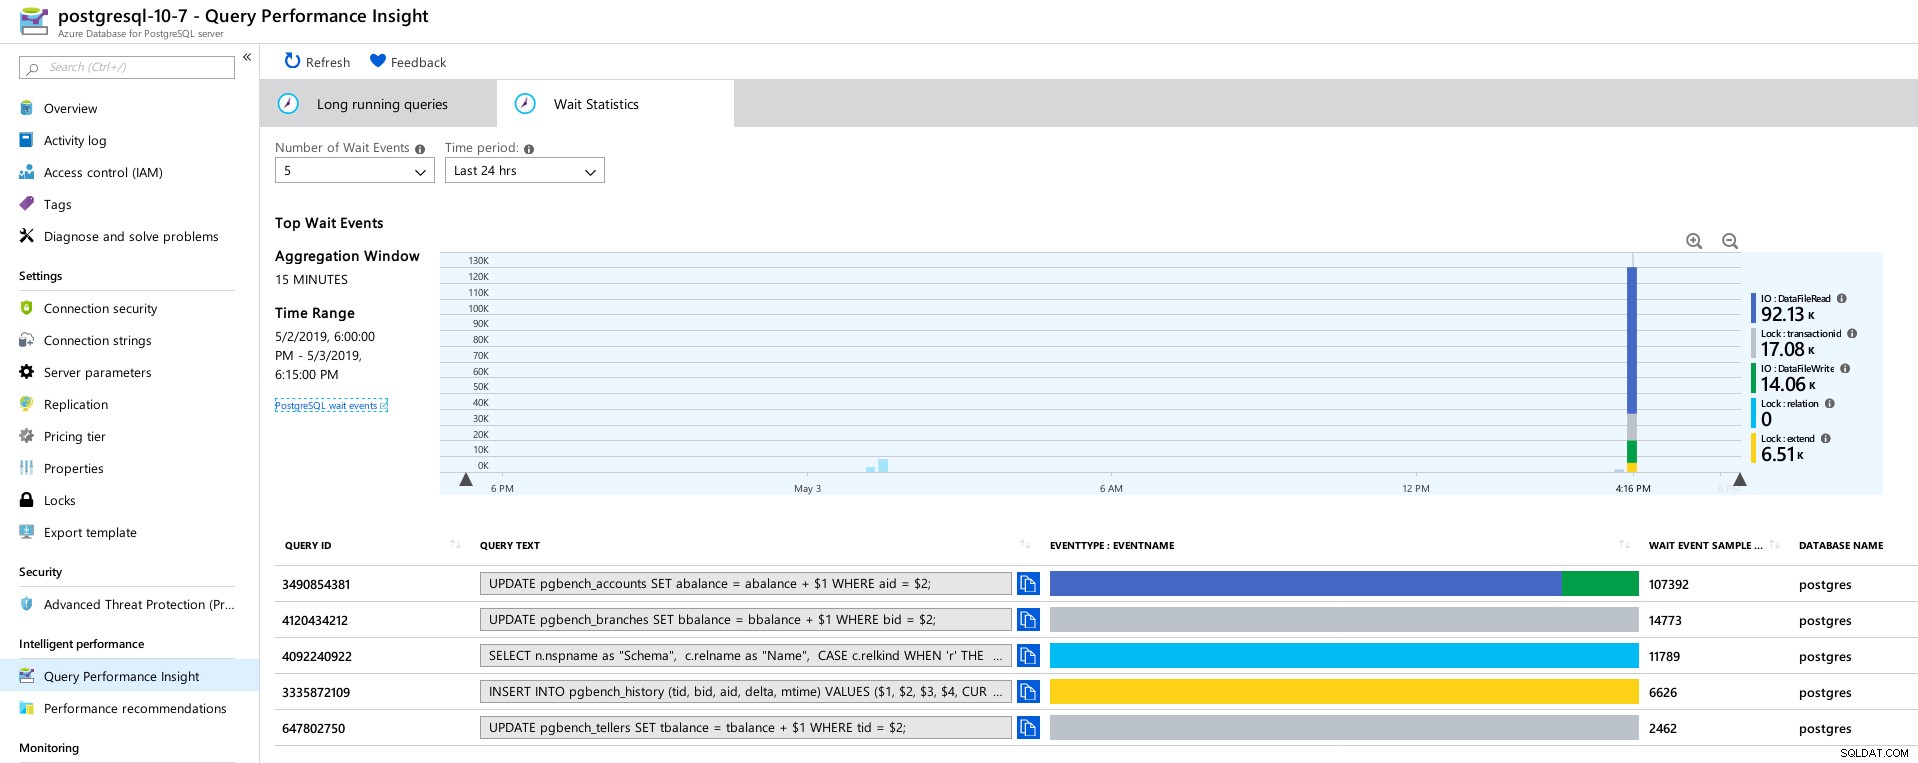 Azure PostgreSQL - Query Performance Insights:Top 5 Waits
 Conclusione
Risorse correlate Benchmarking delle soluzioni Managed PostgreSQL Cloud - Parte prima:Amazon Aurora Benchmarking delle soluzioni Managed PostgreSQL Cloud - Parte seconda:Amazon RDS Benchmarking delle soluzioni Managed PostgreSQL Cloud - Parte terza:Google CloudInnanzitutto, se sei arrivato così lontano, grazie per aver letto, e se ti capita di individuare eventuali errori che potrebbero aver causato un comportamento anomalo dell'ambiente, apprezzerei molto il feedback. A patto che mi sia sfuggito qualcosa di ovvio, sono disposto a ripetere le prove.
L'arresto anomalo del motore di database che porta al dump esadecimale "NT HARD ERROR" indica che si è verificato qualcosa al di fuori del controllo dell'utente e un buon servizio gestito verrebbe ripristinato mediante l'automazione o l'avviso degli SRE responsabili. Se avessi aspettato più tempo sarebbe potuto succedere, anche se solleva la questione di quanto tempo gli utenti devono attendere prima che il servizio venga ripristinato.
Il blocco di max_connections su un valore basato su pricing tier e vCore mi ha colto di sorpresa, soprattutto dopo aver testato gli altri tre servizi gestiti, con Google Cloud che consente all'utente di configurare il parametro, anche se il valore predefinito era molto più basso (600 su G Cloud vs 960 in Azure).
Potrebbe essere necessario un test con l'istanza del database nell'intervallo di 16 core per evitare di alterare i valori predefiniti, anche se in quel momento preferirei testare utilizzando strumenti migliori, come HammerDB (vedi Parte 1 per una discussione sugli strumenti) .